 The wave of startups and entrepreneurship is upon us. We have witnessed these companies change work culture, disrupt industries, and make billionaires out of 20-some-year old’s. However, what is less publicized is the rise of stock compensation and its different forms. Historically, this type of compensation was given to individuals who were in upper management positions. Today, some companies are granting stock options to general employees when they are hired. When examining compensation packages of thriving startups, one can find Non-Qualified Stock Options (“NQSOs”), Incentive Stock Options (“ISOs”), Restricted Stock Units (“RSUs”), Stock Appreciation Rights (“SARs”), and other types littered throughout. These various terms are actually quite different, so in this month’s blog, we have decided to address two forms of employee stock options we typically see – NQSOs and ISOs. We lay out the structure of each and at the end discuss our thoughts on when to exercise.
 Over the past few months there has been several infographics detailing out what has been coined the “Iceberg Effect”. Typically, you see a two-dimensional picture of an iceberg with the word success written across its cap and words such as hard work, late hours, failure, etc. littered throughout the submerged piece. The point: people only see the success of others and miss everything that helped create that success. This metaphor is simple, powerful, and can be universally applied – even to financial planning.
 There are books full of different ways to categorize, screen, and evaluate a good investment, but instead of theories they are called strategies. For example, LBW would be considered a “value” investor because we implement a “value” investing strategy[1]. There are many other strategies such as growth, passive, strategic allocation, dynamic allocation, market neutral, etc. – you get our point. One strategy that has become a hot topic in recent years is Sustainable, Responsible, and Impact investing (SRI). For this month’s blog, we would like to take a dive into what SRI is, how it is categorized, and our general thoughts on this type of strategy.  How LBW Sees It
At the end of the first quarter (“Q1”) of every year, it begins to feel like spring (well sometimes not in WI), bringing great memories. One of my (Tim’s) favorites: the anticipation of knowing that the Salt Lake City Firefighters’ annual Lagoon day was around the corner. It was almost time to go ride the best roller coaster in UT, the Colossus[1]. I would constantly think about getting in the cart and going up the first hill, hearing click, click, click, until finally it was no more. And then boom – flying down the hill, zipping around corners, going around, not just one, but two full loops! It was a kid’s dream. Now, I may not be able to go ride the Colossus this year, but the markets in Q1 stepped in and took its place. For example, from the beginning of Q1 to its peak, the S&P 500 gained roughly 7.45%[2] (the hill). And from its peak to trough[3], it dropped -10.16%[4] (the drop), which, by definition, is a correction[5]. By the end of the quarter, the S&P 500 gained back roughly 8.93%[6] (the loops) of what it had lost and ended the quarter down -1.22%[7] (the finish).  In our blog, “Making the Bet - Part 1: The Game”, we made the point that concentration is often viewed in a vacuum and instead needs to be viewed holistically. Doing so can uncover concentration and previously-unknown risks. However, concentration from a finite level – such as a portfolio level – is just as concerning. If possible, one must be aware of their concentration on a macro level (“The Game”) and a micro level (“The Hand”).
 The word concentration is frequently used in the financial world. Phrases like “you need to be more diversified to avoid concentration” or “you are over-concentrated in equities” are often thrown around by financial professionals, and for good reason, as concentration is a real risk. The issue, however, is these phrases likely pertain to concentration in an asset class, individual company, or some other related stock market investment. Such assessments are made with isolated information, instead of being examined from a holistic view point.
 Introduction
This month’s blog is going to be slightly different than usual; rather than having Tim, Nathaniel or Dan discuss a financial topic, I’ll be writing about my perspective of the financial services industry. But before we get into that, a brief introduction is in order.  How LBW Sees It When defining the 2017 market, one could use phrases such as “good”, “better than expected”, or even “great”; just look at Chart 1[1] 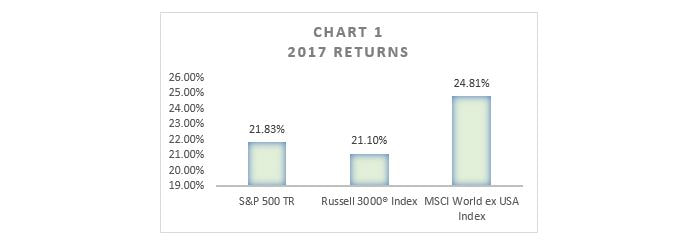  At some point in life you’ve probably thought, “I wish I could get paid without having to go to work.” Luckily for you, that’s exactly what an IRA is for: saving enough money now so that you can pay yourself not to work (commonly known as retirement). To understand how this is done, let’s start with the basics:
The first day of my (Tim) Introductory Microeconomics class our teacher provided us with a few key tenants surrounding microeconomics; 1) assumptions must and will be made (I still don’t agree with this principle and feel it can distort the real world – maybe it will be our next blog post), and 2) there is no such thing as a free lunch. The second point baffled me at first. I had heard of opportunity cost, but I had never truly sat down and thought of its real-life application. Our teacher began peppering us, attempting to see if we could break this fundamental rule. It is a difficult and an almost impossible task. Anything you do has another side of the story; as humans, we are constantly battling a zero-sum game[1]. Opportunity cost is real and is a core tenant not only in economics, but in your financial plan as well.
|
Archives
June 2018
DisclaimersCopyright © 2018 Leach, Bickmore & Weiss Wealth Management, LLC. All rights reserved.
|
 RSS Feed
